The GEO Metrics Framework
The GEO Metrics Framework defines 12 GEO metrics, from Share of Model to Vector Proximity Score, with formulas, notation and worked examples. Free to cite.
September 28, 2026 · 23 min read

On this page12 sections
- Key Takeaways
- GEO in Brief, and Why It Needs Its Own Metrics
- Notation and the Twelve GEO Metrics at a Glance
- Presence and Share Metrics
- Prominence and Proof Metrics
- Perception and Payoff Metrics
- Vector Proximity Score: A Proposed Positioning Metric
- One Panel, Every Metric: The Plannora Scorecard
- How These Definitions Compare With Prior Art
- Cite, Embed and Reuse the Framework
- Where Rankbox Fits
- Frequently Asked Questions
The short answer
GEO metrics are the numbers that describe how AI answers treat a brand: how often they name it, how early, whether they link to it, whether they get its facts right, and what that exposure is worth. The GEO Metrics Framework is Rankbox's open set of twelve such metrics. Each one has a plain definition, a formula in shared notation, a worked example and a note on its limits, so a marketer, an analyst or a lecturer can use the same words for the same math.
Search engine optimization has had shared terms for decades. Everyone knows what click-through rate, a SERP position or PageRank means. Generative engine optimization has no such glossary yet, and the gap shows. Peec AI divides the answers that mention a brand by all answers. Profound divides by the answers that name any brand at all, then averages across AI models. Ahrefs weights share of voice by search volume. All three are reasonable. But a "40% visibility" figure from one tool and the same figure from another can describe different things.
The research world has a definition too. The 2023 paper that named GEO scored a source by the words an answer drew from it, weighted by where its citation appeared. That suits a lab with full answer text. Most teams need numbers they can count by hand from a spreadsheet of answers.
This page is a reference, not a how-to. It gives each metric's math and says where it came from. For running a measurement program week to week, see our guides to measuring GEO and tracking brand mentions in AI search. New to the term itself? Start with our plain-English guide to what generative engine optimization is.
Key Takeaways
- The GEO Metrics Framework (version 1.0, 28 September 2026) defines twelve GEO metrics in seven layers: presence, share, prominence, proof, perception, payoff and positioning.
- Share of Model (SoM) is the share of runs, across category prompt variants, in which an answer names your brand. Average within each variant first, then across variants, and report a confidence interval.
- Citation Density (CD) counts distinct cited sources per 1,000 answer tokens, using the o200k_base tokenizer that OpenAI's GPT-4o and GPT-5 models use.
- Vector Proximity Score (VPS) is Rankbox's proposed proxy for how close a brand's positioning sits to the problems buyers describe. In a worked example with the open bge-base-en-v1.5 model, a fictional agency tool scored 0.5367 against a rival's 0.4556.
- Vendors use the same words for different math. Peec, Profound, Semrush and Ahrefs each calculate "visibility" or "share of voice" differently, so compare numbers only inside one method.
- Every rate here is an estimate from a sample of answers. With 60 answers, a 35% Share of Model has a 95% interval of about 24% to 48%.
- The framework is free to use, cite and embed. Rankbox's own dashboard does not report these metrics, and Rankbox doesn't track AI citations today.
GEO in Brief, and Why It Needs Its Own Metrics
Generative engine optimization (GEO) is the work of getting a brand named, cited and described correctly in answers that AI systems write, such as ChatGPT, Perplexity, Gemini and Google's AI Overviews. The term comes from a November 2023 paper by Pranjal Aggarwal and colleagues at Princeton, IIT Delhi and other institutions, later accepted at KDD 2024. Our GEO glossary entry and the plain-English GEO guide cover the practice itself.
Google treats the label with some caution. Its AI optimization guide says that from its point of view, "optimizing for generative AI search is optimizing for the search experience, and thus still SEO." The work may overlap with SEO. The measurement doesn't, because an AI answer has no fixed rank and changes from one run to the next. That's why GEO metrics need definitions of their own.
Here is how the familiar SEO numbers map to their nearest GEO metrics:
| SEO metric | Nearest GEO metric | What changes |
|---|---|---|
| Impressions | Share of Model, Visibility Rate | The answer varies by run, so presence becomes a rate across repeated samples |
| Ranking position | Average Answer Position, First-Mention Rate | No stable order exists; position only means something as an average |
| Referring domains, PageRank | Citation Share, Citation Rate | The unit is a cited source inside one answer, not a link across the web |
| Click-through rate | AI Referral Share | Most answers end without a click, so visits understate exposure |
| Keyword relevance | Vector Proximity Score | Retrieval can match by meaning, not only by matching words |
Notation and the Twelve GEO Metrics at a Glance
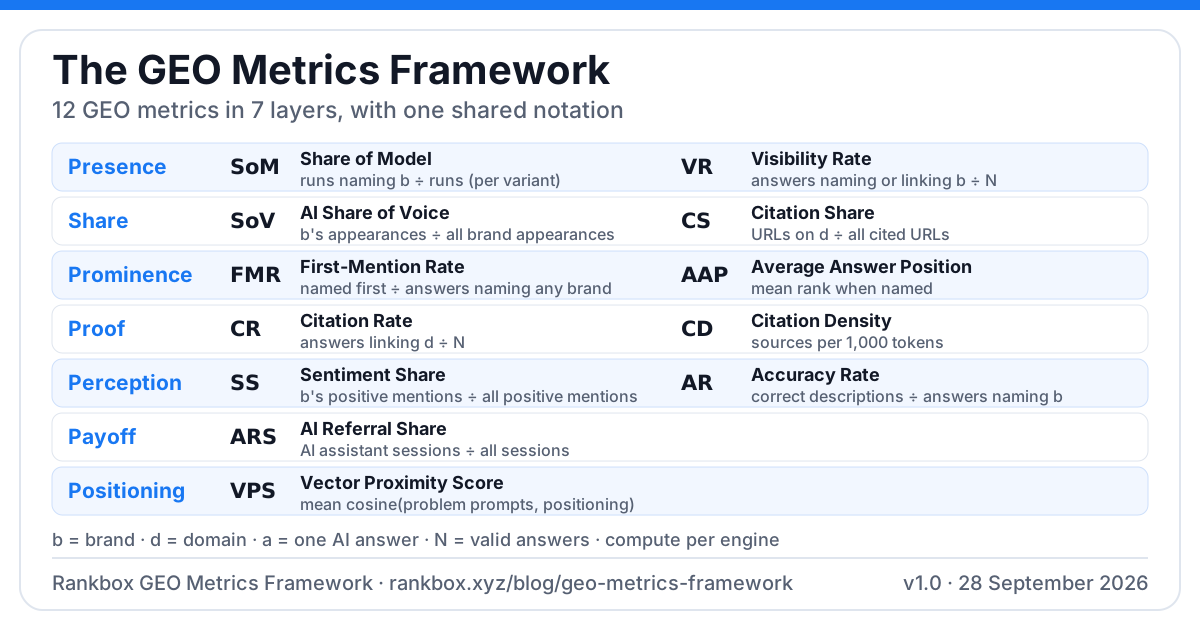
Every metric below uses the same symbols. Shared notation is what lets two teams compare GEO metrics without arguing about what a number means.
- Q is a panel of prompts. V ⊆ Q is the set of category prompt variants: unbranded prompts that ask for a solution, a shortlist or a comparison ("best tool for X", "how do I solve Y"). Brand prompts that contain your name are excluded from V.
- e is an engine and mode, such as ChatGPT with search on. Compute every metric per engine. If you must blend engines, give each engine equal weight and say so.
- K_v is the number of valid runs of variant v. A run is valid when the engine returns an answer. Errors, refusals and empty replies are dropped from numerator and denominator alike, and their count is reported.
- a_{v,r} is the answer to run r of variant v. A is the set of all valid answers, and N = |A|.
- m(b, a) equals 1 if answer a names brand b in its visible text, counting the brand's listed aliases and product names once per answer, and 0 otherwise.
- l(d, a) equals 1 if answer a links to at least one URL on domain d.
- c(d, a) is the number of distinct URLs on domain d that answer a cites. C(a) is all distinct cited URLs in a.
- pos(b, a) is b's rank among all brands named in a, in order of first appearance, starting at 1.
- T(a) is the token count of a's visible text, measured with the o200k_base tokenizer.
The framework groups twelve GEO metrics into seven layers:
| Layer | Metric | Formula (short form) | Range |
|---|---|---|---|
| Presence | Share of Model (SoM) | Mean over variants of the share of runs that name b | 0–100% |
| Presence | Visibility Rate (VR) | Answers that name or link b ÷ N | 0–100% |
| Share | AI Share of Voice (SoV) | Answers naming b ÷ all brand appearances | 0–100%, sums to 100% |
| Share | Citation Share (CS) | Cited URLs on d ÷ all cited URLs | 0–100%, sums to 100% |
| Prominence | First-Mention Rate (FMR) | Answers where b is named first ÷ answers naming any brand | 0–100% |
| Prominence | Average Answer Position (AAP) | Mean pos(b, a) over answers naming b | 1 or more, lower is earlier |
| Proof | Citation Rate (CR) | Answers linking d ÷ N | 0–100% |
| Proof | Citation Density (CD) | 1,000 × distinct cited URLs ÷ tokens | 0 or more |
| Perception | Sentiment Share (SS) | Positive mentions of b ÷ all positive brand mentions | 0–100% |
| Perception | Accuracy Rate (AR) | Correct descriptions of b ÷ answers naming b | 0–100% |
| Payoff | AI Referral Share (ARS) | AI assistant sessions ÷ all sessions | 0–100% |
| Positioning | Vector Proximity Score (VPS) | Mean cosine similarity of problem prompts and positioning statement | −1 to 1 |
The worked examples share one made-up panel. Plannora, a fictional project management tool for agencies, runs 20 category prompt variants three times each in one engine: 60 valid answers. Loopcraft and Taskwell are fictional rivals. The inputs are illustrative; the arithmetic is exact.
Presence and Share Metrics
Share of Model (SoM)
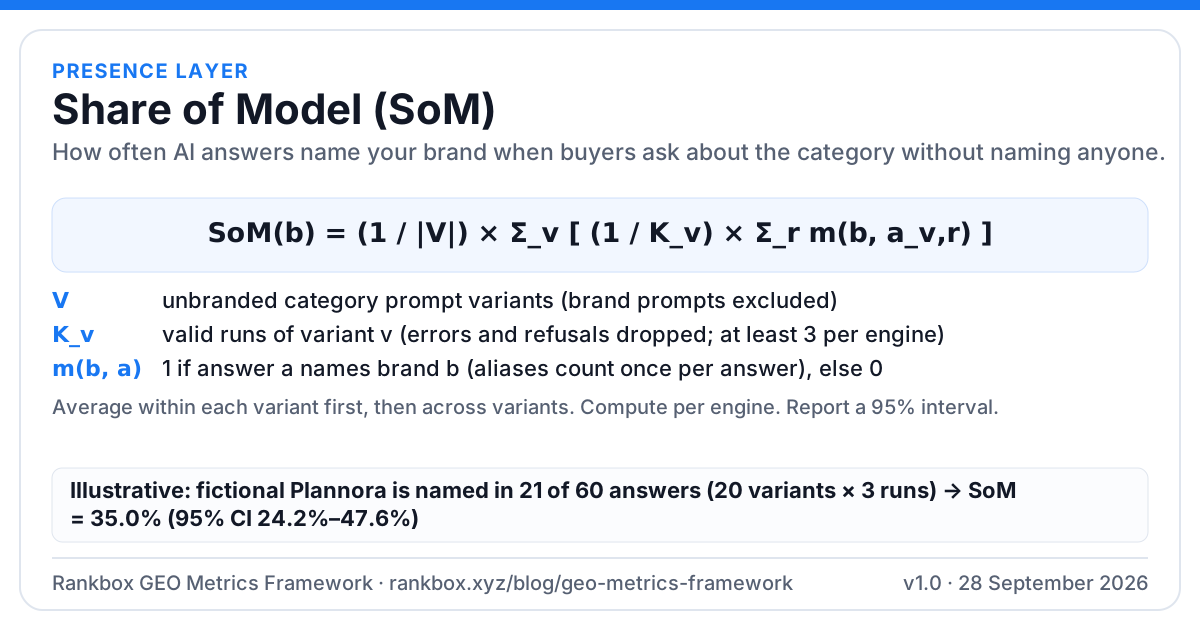
Share of Model is the share of runs, across category prompt variants, in which an AI answer names your brand. It asks the most basic question among GEO metrics: when a buyer describes a need without naming anyone, does the model think of you?
SoM(b) = (1 / |V|) × Σ_v [ (1 / K_v) × Σ_r m(b, a_{v,r}) ]- Numerator: for each variant, the runs whose answer names b.
- Denominator: that variant's valid runs, K_v. Each variant's rate is then averaged with equal weight.
- Run count: at least 3 runs per variant per engine per period. When every variant has the same K, SoM equals the pooled count divided by N.
- Repeated runs: average within a variant before averaging across variants. This stops a variant with more surviving runs from counting more. A stricter "majority rule" counts a variant only when b appears in at least half of its runs. It's more stable but throws away detail, so report it alongside SoM, never instead of it.
- Uncertainty: report a 95% Wilson interval. The Don't Measure Once authors put it well: visibility should be treated "as a distribution rather than a single-point outcome."
Worked example. Plannora is named in 21 of 60 answers, so SoM = 21 ÷ 60 = 35.0%, with a 95% interval of 24.2% to 47.6%. Loopcraft is named in 33, a SoM of 55.0% (42.5% to 66.9%). Under the majority rule, Plannora appears in at least two of three runs for 6 of 20 variants: 30.0%.
The term "share of model" predates this framework. In July 2024, Tom Roach wrote in Marketing Week that Jack Smyth of Jellyfish started using it early that year, defined as "the number of mentions of a brand by one or multiple LLMs, as a proportion of total mentions of brands in the same category." Jellyfish later launched a Share of Model™ platform. That original definition is a share of all brand mentions, which this framework calls AI Share of Voice. Here, SoM is a presence rate on unbranded prompts. We kept the name because it's already in use, and we flag the difference so no one mixes the two.
Visibility Rate (VR)
Visibility Rate is the share of all answers that name your brand or link to your site. It's broader than SoM in two ways: it counts a link without a mention, and it can cover the whole panel, brand prompts included.
VR(b) = (1 / N) × Σ_a max( m(b, a), l(d_b, a) )Plannora is named in 21 answers and linked without being named in 4 more, so VR = 25 ÷ 60 = 41.7%. Our AI visibility glossary entry covers the broader idea.
AI Share of Voice (SoV)
AI Share of Voice is your brand's slice of all brand appearances in the panel. Each brand counts at most once per answer. Unlike SoM, the shares of all brands add up to 100%.
SoV(b) = Σ_a m(b, a) ÷ Σ_a Σ_{b'} m(b', a)The panel holds 126 brand appearances: Plannora 21, Loopcraft 33, Taskwell 27 and other brands 45. Plannora's SoV is 21 ÷ 126 = 16.7%, and Loopcraft's is 26.2%. SoV can fall while SoM holds steady, when a rival gains and you don't lose. The AI share of voice glossary entry compares the two ways of counting.
Citation Share (CS)
Citation Share is your domain's slice of all sources cited across the panel. It's the site-level twin of SoV, and the best single number for comparing domains.
CS(d) = Σ_a c(d, a) ÷ Σ_a |C(a)|The 60 answers cite 412 distinct URLs in total, 11 of them on plannora.io. So CS = 11 ÷ 412 = 2.7%, against 9.2% for loopcraft.ai. Microsoft uses the same idea for a single grounding query: Bing's Citation Share is "the percentage of citations attributed to your site out of all citations shown across all sites for that same grounding query." For a site-level benchmark built on this metric, see our guide to benchmarking website performance in AI search.
Prominence and Proof Metrics
First-Mention Rate (FMR)
First-Mention Rate is the share of answers that name any brand in which yours comes first. The denominator leaves out answers that name no brand, so every brand's FMR is measured against the same pool.
FMR(b) = #{ a : pos(b, a) = 1 } ÷ #{ a : Σ_{b'} m(b', a) ≥ 1 }Of 57 answers that name a brand, Plannora comes first in 6: FMR = 10.5%. Loopcraft leads 19 times, for 33.3%.
Average Answer Position (AAP)
Average Answer Position is your mean rank among the brands an answer names, counting only answers that name you. Lower is earlier.
AAP(b) = Σ_{a : m(b,a)=1} pos(b, a) ÷ Σ_a m(b, a)Plannora's positions add up to 63 across its 21 answers, so AAP = 3.00. Loopcraft's add up to 56 across 33, so AAP = 1.70. Always report AAP next to SoM, because it says nothing about the answers that leave you out. A brand named once, first, has a perfect AAP and almost no presence.
Treat single positions with suspicion. When SparkToro and Gumshoe had 600 volunteers run 12 prompts 2,961 times, they put the odds of getting the same list twice at under 1 in 100, and the same order at about 1 in 1,000. An average across many runs is a fair measure. A rank from one answer isn't.
Citation Rate (CR)
Citation Rate is the share of answers that link to at least one page on your domain. It separates a clickable win from a mention. Our AI citation glossary entry covers the difference.
CR(d) = Σ_a l(d, a) ÷ NPlannora is linked in 9 of 60 answers, a CR of 15.0%. Loopcraft is linked in 24, for 40.0%. Watch for a name clash: Peec's February 2026 citation rate study uses "citation rate" for how often a retrieved page is cited per answer. Both uses are valid. They measure different things.
Citation Density (CD)
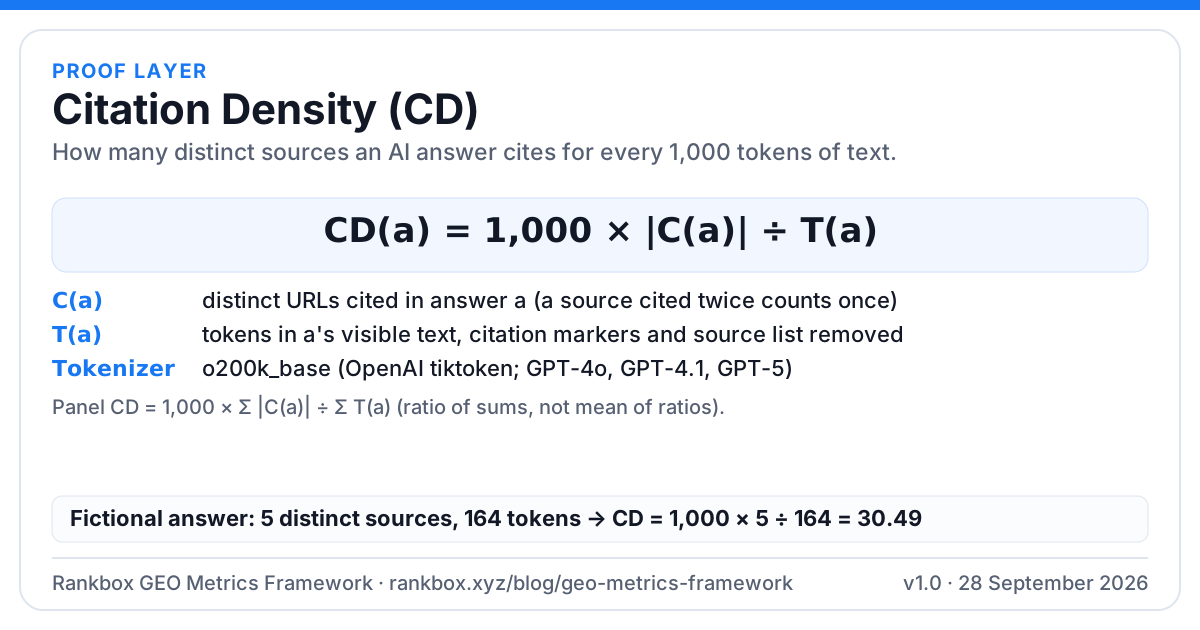
Citation Density is the number of distinct sources an answer cites per 1,000 tokens of answer text. It describes the answer, not your brand. A dense answer spreads credit across many sources, so each citation is worth less attention. A sparse one concentrates it.
CD(a) = 1,000 × |C(a)| ÷ T(a)CD(panel) = 1,000 × Σ_a |C(a)| ÷ Σ_a T(a)Three choices make CD comparable:
- Count distinct URLs. A source cited twice counts once, because the question is how many sources share the answer.
- Strip the markers. Remove citation markers such as "[2]" and the source list before counting tokens. Engines format them differently, and they'd inflate T.
- Use one named tokenizer. This framework uses o200k_base. OpenAI's tiktoken library maps GPT-4o, GPT-4.1 and GPT-5 models to it, and it's open source. Other models split text differently, so a word-count shortcut is only an approximation.
Worked example. A made-up 136-word answer recommends Plannora, Loopcraft and Taskwell and cites five distinct sources, one of them twice. With the markers removed, the text is 164 tokens under o200k_base (counted with the Xenova/gpt-4o port of the tokenizer). So CD = 1,000 × 5 ÷ 164 = 30.49. Counting the six markers instead of five sources, on the unstripped 176 tokens, would give 34.09, which is why the two rules matter. Across the whole panel, 412 sources over 19,860 tokens gives a panel CD of 20.7.
Perception and Payoff Metrics
Sentiment Share (SS)
Sentiment Share is your share of all positive brand mentions in the panel. Label each mention positive, neutral or negative with a written rubric, and check a sample by hand.
SS(b) = positive mentions of b ÷ positive mentions of all brandsPlannora earns 12 of 71 positive mentions, an SS of 16.9%. Also report the within-brand positive rate: 12 of Plannora's 21 mentions are positive, or 57.1%, against Loopcraft's 24 of 33, or 72.7%. Vendors differ here more than anywhere. Profound scores claims as positive or negative; Peec uses a 0 to 100 tone score and says most scores fall between 65 and 85.
Accuracy Rate (AR)
Accuracy Rate is the share of answers naming your brand that describe it correctly: price, plan names, features, who it's for. Check each claim against a written fact sheet.
AR(b) = answers naming b with no factual error ÷ answers naming b17 of Plannora's 21 mentions are error-free: AR = 81.0%. A wrong price in an answer can cost the deal the mention was meant to win, so AR belongs in any report that shows SoM.
AI Referral Share (ARS)
AI Referral Share is the share of your site's sessions that arrive from AI assistants. It's the payoff layer, measured in your own analytics rather than in answers. Our AI referral traffic glossary entry covers the sources.
ARS = sessions from AI assistants ÷ all sessionsPlannora's GA4 custom channel shows 612 AI assistant sessions out of 48,900 in September: ARS = 1.25%. Write down which referrer sources count as AI assistants, so the number means the same thing every month. Our GA4 guide to AI referral traffic has a rule you can copy.
Vector Proximity Score: A Proposed Positioning Metric
Vector Proximity Score is Rankbox's proposed metric for how close a brand's positioning statement sits, in meaning, to the problems buyers describe. It's a leading indicator. The other eleven GEO metrics describe answers and visits after the fact. VPS asks whether your own description of yourself even resembles the questions you want to win.
Definition
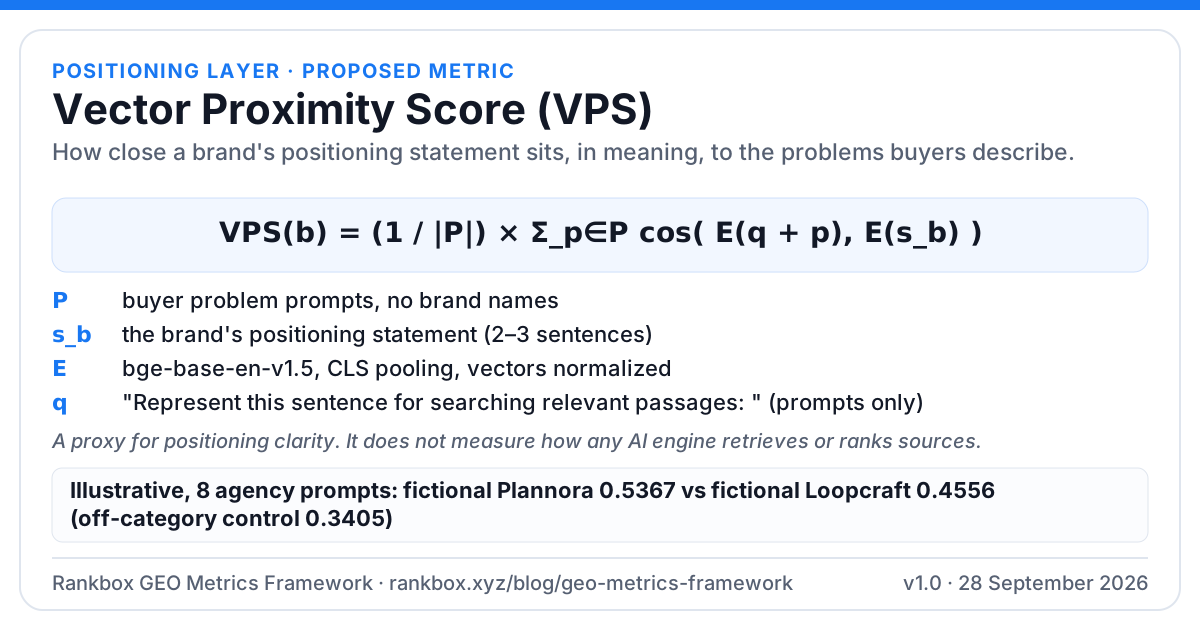
Take a set P of problem prompts, written the way buyers describe the need, with no brand names. Take your positioning statement s_b: the two or three sentences your homepage or About page uses to say what you do and for whom. Embed both with one named open model and average the cosine similarities, which are the dot products of the normalized vectors.
VPS(b) = (1 / |P|) × Σ_{p ∈ P} cos( E(q + p), E(s_b) )Here E is the embedding model and q is the model's query instruction. Version 1.0 fixes the setup so anyone can reproduce a score:
- Model: bge-base-en-v1.5, an open model from BAAI under the MIT licence, run through its Transformers.js port with 8-bit weights.
- Query instruction: "Represent this sentence for searching relevant passages: " on each prompt, as the model card specifies, and none on the statement.
- Pooling: the [CLS] token, with vectors normalized to length 1.
- Control: also score an off-category statement. Report VPS alongside the control-adjusted score, VPS minus the control's VPS, since raw cosine values sit well above zero even for unrelated text (0.3405 for the control below).
For a plain explanation of embeddings and cosine similarity, see Rankbox's experiment on vector distance vs keyword density and the vector embeddings glossary entry.
Worked example: Plannora vs Loopcraft
The problem set has eight prompts an agency owner might type. Plannora's statement describes an agency tool that turns briefs into task boards, tracks billable hours against budgets and offers a client approval portal. Loopcraft's describes an AI workspace for software teams. Two more rows test the method: a vague tagline for Plannora ("the all-in-one work platform that helps teams do their best work, together") and an off-category control for a made-up coffee brand. All four statements are fictional, and the prompts below are shortened. Every number is copied exactly from the script's output.
| Problem prompt | Plannora | Plannora, vague tagline | Loopcraft | Coffee control |
|---|---|---|---|---|
| Stop client projects going over budget | 0.5883 | 0.4612 | 0.4277 | 0.2816 |
| Get client approval on design work | 0.5056 | 0.4222 | 0.4317 | 0.3713 |
| Track billable hours for several clients | 0.5587 | 0.5089 | 0.4190 | 0.3946 |
| Keep track of deadlines across many clients | 0.5133 | 0.4481 | 0.4377 | 0.3376 |
| Turn a client brief into a list of tasks | 0.5623 | 0.5331 | 0.4488 | 0.3180 |
| See which team members have time | 0.5311 | 0.5373 | 0.5195 | 0.3083 |
| Share progress with clients without endless emails | 0.5489 | 0.4866 | 0.5220 | 0.3715 |
| Stop scope creep on fixed-fee projects | 0.4853 | 0.3830 | 0.4382 | 0.3409 |
| VPS (mean of 8) | 0.5367 | 0.4725 | 0.4556 | 0.3405 |
Three readings follow from the table:
- Plannora sits closer to these problems than its rival does. Its VPS is 0.0811 higher than Loopcraft's, and it scores higher on all eight prompts. Above the coffee control, Plannora's margin is 0.1962 and Loopcraft's is 0.1151.
- Specific positioning scores higher than vague positioning. Swapping the tagline for the specific statement raises VPS by 0.0641.
- The metric isn't a blunt instrument. On the generic prompt about team capacity, the vague tagline edged out the specific statement, 0.5373 to 0.5311. Generic words match generic needs.
What VPS is not
VPS measures geometry in one open model's vector space. It isn't a measure of how ChatGPT, Perplexity, Gemini or any other engine retrieves or ranks sources. The model was chosen because it's open and reproducible, not because any engine is known to use it, and Google's guide says plainly: "No third-party tool has access to our internal ranking or AI systems." Treat VPS as a proxy for clarity of positioning, compare scores only within one model and one prompt set, and never read a small gap as a ranking forecast.
One Panel, Every Metric: The Plannora Scorecard
Put together, the GEO metrics from the illustrative panel fill a one-page scorecard. Each cell has one agreed meaning.
| Metric | Plannora | Loopcraft | What it tells Plannora |
|---|---|---|---|
| Share of Model | 35.0% (24.2–47.6) | 55.0% (42.5–66.9) | Named in about a third of runs; the rival in over half |
| Visibility Rate | 41.7% | 58.3% | Links without mentions add little |
| AI Share of Voice | 16.7% | 26.2% | A smaller slice of a crowded answer |
| Citation Share | 2.7% | 9.2% | The engine rarely cites Plannora's own pages |
| First-Mention Rate | 10.5% | 33.3% | Rarely the lead recommendation |
| Average Answer Position | 3.00 | 1.70 | Listed third on average when named |
| Citation Rate | 15.0% | 40.0% | Few answers link to plannora.io |
| Sentiment Share | 16.9% | 33.8% | Fewer warm descriptions |
| Accuracy Rate | 81.0% | Not measured | One mention in five has an error |
| AI Referral Share | 1.25% | Not visible | Only measurable for your own site |
| Vector Proximity Score | 0.5367 | 0.4556 | Positioning already fits the problems |
The pattern points to a clear diagnosis. Plannora's positioning fits the buyer's problems (VPS), yet engines rarely cite its pages (CS, CR) and rank it low (FMR, AAP). The gap is citable evidence on the web, not a fuzzy message. Sampling error applies to every rate row. The SoM intervals for Plannora and Loopcraft overlap slightly at 60 answers, so a larger panel would firm up that gap.
Benchmarking a website against competitors with these metrics
To benchmark website performance against competitors in AI search, compute the same metrics for each rival from the same answers, engine by engine. Citation Share and Citation Rate compare domains and pages. SoM, SoV, FMR and AAP compare brands. Our guide to benchmarking website performance in AI search applies them at the domain and page level. For a brand-level rival matrix, see how to benchmark your brand's AI citations against competitors, and for baselines over time, how to benchmark AI search performance.
How These Definitions Compare With Prior Art
This framework builds on others' work. The table shows where each definition matches an existing one and where it differs.
| Source | Their term and definition | How the framework differs |
|---|---|---|
| Aggarwal et al., KDD 2024 | Position-Adjusted Word Count: words in sentences citing a source, weighted down the later they appear, ÷ all words | Counts answers and sources, which a team can tally by hand |
| Roach and Smyth, 2024 | Share of model: brand mentions ÷ all brand mentions in the category | That is our SoV; our SoM is a presence rate |
| Peec AI docs | Visibility: responses mentioning the brand ÷ total responses | Same idea as SoM, but we limit SoM to unbranded category prompts |
| Profound docs | Visibility: runs naming your brand ÷ runs naming any brand, averaged per model | Our SoM keeps brandless answers in the denominator |
| Semrush | AI share of voice uses mentions and position; for ChatGPT in Enterprise AIO, topic search volume too | We keep position out of SoV and report AAP separately |
| Ahrefs Brand Radar | AI share of voice: share of impressions, which are search-volume weighted | Our SoV is unweighted, so any prompt set works |
| Bing Webmaster Tools | Citation Share per grounding query | Same formula as our CS, applied to a whole prompt panel |
Sources for the table: the GEO paper, Marketing Week, Peec's visibility docs, Profound's metric formulas, Semrush's share of voice guide (July 2026), Ahrefs' help center and Bing's June 2026 update. Even one vendor can word things two ways. The FAQ on Ahrefs' Brand Radar page describes AI share of voice as the percentage of responses that "mention or cite your brand versus competitors," while its help center uses impressions.
Paid trackers compute related GEO metrics under their own definitions. Peec AI's Starter plan, for example, was $95 a month for 50 prompts on its pricing page on 28 September 2026. Map a tool's metrics to the table above before you compare its numbers with a hand-built panel.
Known limitations
- Sampling error. All of these GEO metrics except VPS are estimates from a sample of answers. Runs of one prompt aren't fully independent, so true intervals are wider than the Wilson figures. Our post on the technical reality of tracking AI answers explains why.
- Drift. Engines change models, search providers and citation habits. A metric can move while you do nothing, which is why a control group matters.
- Parsing choices. Alias lists, list parsing for position and sentiment labels all involve judgment. Publish your rules with your numbers.
- Tokenizer dependence. CD values shift with the tokenizer. Always name it.
- VPS is a proxy. It depends on the model, the prompt set and the wording of the statement, and it predicts no engine's behaviour.
Cite, Embed and Reuse the Framework
The GEO Metrics Framework is an open standard. Use the names and formulas in your own reports, tools, courses and papers. Please cite it as: Rankbox, "The GEO Metrics Framework", version 1.0, 28 September 2026, https://rankbox.xyz/blog/geo-metrics-framework.
Embed these diagrams
Four diagrams are available as SVG files. Each shows a title, the formula, its variables and one worked example. Copy a snippet into any page.
Share of Model:
<a href="https://rankbox.xyz/blog/geo-metrics-framework"><img src="https://rankbox.xyz/research/geo-metrics/share-of-model.svg" alt="Share of Model formula: the mean, across category prompt variants, of the share of runs whose AI answer names the brand" width="1200" height="630" style="max-width:100%;height:auto"></a><p>Source: <a href="https://rankbox.xyz/blog/geo-metrics-framework">Rankbox GEO Metrics Framework</a></p>Citation Density:
<a href="https://rankbox.xyz/blog/geo-metrics-framework"><img src="https://rankbox.xyz/research/geo-metrics/citation-density.svg" alt="Citation Density formula: distinct cited sources per 1,000 tokens of AI answer text, counted with the o200k_base tokenizer" width="1200" height="630" style="max-width:100%;height:auto"></a><p>Source: <a href="https://rankbox.xyz/blog/geo-metrics-framework">Rankbox GEO Metrics Framework</a></p>Vector Proximity Score:
<a href="https://rankbox.xyz/blog/geo-metrics-framework"><img src="https://rankbox.xyz/research/geo-metrics/vector-proximity-score.svg" alt="Vector Proximity Score formula: mean cosine similarity between buyer problem prompts and a brand's positioning statement in one open embedding model" width="1200" height="630" style="max-width:100%;height:auto"></a><p>Source: <a href="https://rankbox.xyz/blog/geo-metrics-framework">Rankbox GEO Metrics Framework</a></p>Framework overview:
<a href="https://rankbox.xyz/blog/geo-metrics-framework"><img src="https://rankbox.xyz/research/geo-metrics/geo-metrics-overview.svg" alt="The GEO Metrics Framework: twelve GEO metrics in seven layers, from presence to positioning" width="1200" height="630" style="max-width:100%;height:auto"></a><p>Source: <a href="https://rankbox.xyz/blog/geo-metrics-framework">Rankbox GEO Metrics Framework</a></p>Licence: the diagrams and formulas are free to embed with a link to this page.
Where Rankbox Fits
Rankbox publishes this framework as an open standard. Its dashboard does not report these GEO metrics, and Rankbox doesn't track AI citations, mentions or share of voice today. To collect the answers by hand, use a spreadsheet, the reports Google and Bing give you, GA4, or a third-party tracker, and apply the formulas above.
Where Rankbox helps is on the inputs. Answer-Space Research maps the questions buyers ask AI in your category, which is a fast way to build the prompt set behind SoM and VPS. The Citation-Ready Writer then writes source-backed articles for the gaps a scorecard reveals, and they reach your site through Rankbox's API. The Business plan costs $49.50 a month with a 7-day trial: see pricing. For a free start, the AI Visibility Prompt Kit writes 30 buyer prompts and a manual scorecard.
Frequently Asked Questions
What are GEO metrics?
GEO metrics are measures of how AI-generated answers present a brand. They count how often answers name it, how early, whether they link to its site, whether they describe it correctly and how many visits follow. The GEO Metrics Framework defines twelve of them with shared notation.
What is Share of Model in AI search?
Share of Model is the share of runs, across unbranded category prompts, in which an AI answer names your brand. In this framework it's a presence rate, averaged per prompt variant. Marketing Week's 2024 definition, credited to Jellyfish, is a share of all brand mentions, which we call AI Share of Voice.
How do you calculate citation density?
Count the distinct sources an AI answer cites, divide by the answer's token count, and multiply by 1,000. Strip citation markers first and name the tokenizer. The framework uses o200k_base, so a 164-token answer citing five sources has a citation density of 30.49.
What is a Vector Proximity Score?
A Vector Proximity Score is the mean cosine similarity between buyer problem prompts and a brand's positioning statement, embedded with one open model. Rankbox proposes it as a proxy for positioning clarity. It doesn't measure how any AI engine ranks sources.
How many runs do GEO metrics need?
Run each prompt variant at least three times per engine per period, and report a confidence interval with every rate. At 60 answers, a 35% rate carries a 95% interval of roughly 24% to 48%, so small panels can only show large gaps.
Is share of model the same as share of voice?
Not in this framework. Share of Model is a presence rate: the share of runs that name you, where every brand can score high at once. AI Share of Voice is your slice of all brand appearances, so all brands add up to 100%.
References
- 1.GEO: Generative Engine Optimization (Aggarwal et al., KDD 2024), arXivarxiv.org ↗
- 2.GEO: Generative Engine Optimization, full text v3, arXivarxiv.org ↗
- 3.'Share of model' is the new marketing measure for the AI era, Marketing Weekmarketingweek.com ↗
- 4.Jellyfish launches the Share of Model platform, Jellyfishjellyfish.com ↗
- 5.Visibility, Peec AI Docsdocs.peec.ai ↗
- 6.Sentiment, Peec AI Docsdocs.peec.ai ↗
- 7.What does a good citation rate look like?, Peec AIpeec.ai ↗
- 8.How metrics are calculated, Profound Docsdocs.tryprofound.com ↗
- 9.How to measure AI share of voice using Semrush, Semrushsemrush.com ↗
- 10.AI visibility metrics, Ahrefs Help Centerhelp.ahrefs.com ↗
- 11.Brand Radar, Ahrefsahrefs.com ↗
- 12.New AI visibility insights in Bing Webmaster Tools, Microsoft Bingblogs.bing.com ↗
- 13.Optimizing your website for generative AI features, Google Search Centraldevelopers.google.com ↗
- 14.AIs are highly inconsistent when recommending brands or products, SparkTorosparktoro.com ↗
- 15.Don't Measure Once: Measuring Visibility in AI Search (Schulte, Bleeker and Kaufmann, 2026), arXivarxiv.org ↗
- 16.tiktoken, OpenAI on GitHubgithub.com ↗
- 17.GPT-4o tokenizer (Xenova/gpt-4o), Hugging Facehuggingface.co ↗
- 18.bge-base-en-v1.5 model card, BAAI on Hugging Facehuggingface.co ↗
- 19.bge-base-en-v1.5 for Transformers.js (Xenova), Hugging Facehuggingface.co ↗
- 20.Pricing, Peec AIpeec.ai ↗